
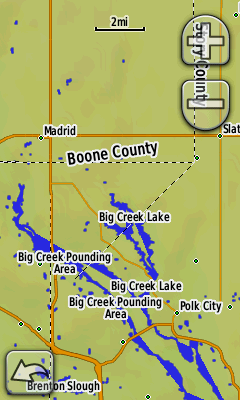
I'm having an issue with the drawing of a county boundary in mkgmap. I've attached a screenshot from my Oregon 300 that shows the issue. The diagonal line in the middle is incorrect (the top right corner of the diagonal line is at 41.8623 -93.6999). The boundary looks correct in JOSM. Could it be because the boundary line is split across two tiles? I've been downloading the OSM data for Iowa using the xapi, splitting that up with spliiter (rev 28 currently) and generating the map with mkgmap (rev 1006 currently but I'm generating a new map with 1010 now. This is the bbox I use to download the OSM data: bbox=-96.723633,40.341797,-90.131836,43.549805 After splitting these are the tiles I end up with: a (38.49609375,-100.458984375) to (41.7919921875,-93.6474609375), size=1170389 a (41.7919921875,-100.458984375) to (44.47265625,-93.6474609375), size=991407 a (38.49609375,-93.6474609375) to (41.8798828125,-87.802734375), size=996288 a (41.8798828125,-93.6474609375) to (44.47265625,-87.802734375), size=869310 Also, the water areas aren't getting rendered correctly. Osmarender has a problem with them too but mapnik seems to get it right so maybe this is a data problem. -- Jeff Ollie